
Introduction
Domestic debt is that part of public debt that is payable to creditors within the country. In Kenya, domestic debt is composed of treasury bills, treasury bonds, pre-1997 government overdraft at the Central Bank of Kenya (CBK), tax reserve certificates and commercial bank advances. Treasury bills and treasury bonds have on average accounted for 97 per cent of the gross domestic debt in the last decade. In the same period, domestic debt has grown from 53.7 per cent to 78.6 per cent of the country’s public debt stock. Besides the rising domestic debt stock, the composition of domestic debt, the exposure of each debt instruments to rollover and interest rate risks, and the alignment of domestic debt to the borrowing debt mix strategy are of interest to policy makers.
Composition of domestic debt and the associated risks
The composition of the domestic debt matters for sustained macroeconomic stability. The economy is exposed to interest rate and rollover risks depending on the type and years to maturities of the domestic debt instruments as this affects interest rates and the ability of the country to service the debt obligation. Domestic debt is mainly comprised of treasury bonds and bills with a proposed debt strategy of bonds to bills ratio as 70:30 that the government has maintained since 2010. Treasury bills are short-term domestic debt instruments that mature in 91, 182 or 364 days while treasury bonds are medium-term to long-term domestic debt instruments with maturities ranging from 1 year to 30 years.
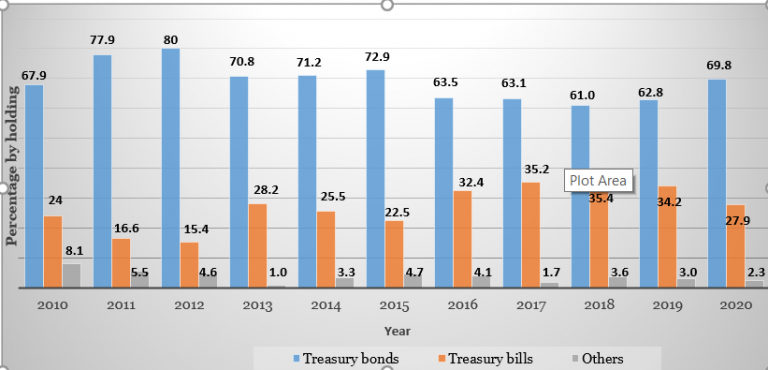
The proportion of treasury bills to the total treasury instruments slightly declined from 24.0 per cent in 2010 to 22.5 per cent in 2015 and then rose to 27.9 per cent in 2020, having reached a high of 35.0 per cent between 2017 and 2019 as shown in Figure 1. As such, treasury bonds constituted the largest proportion of domestic debt in Kenya between 2010 and 2020. This in line with the government strategy to prolong debt maturities in reducing the rollover risk.
Figure 1: Domestic debt by instrument
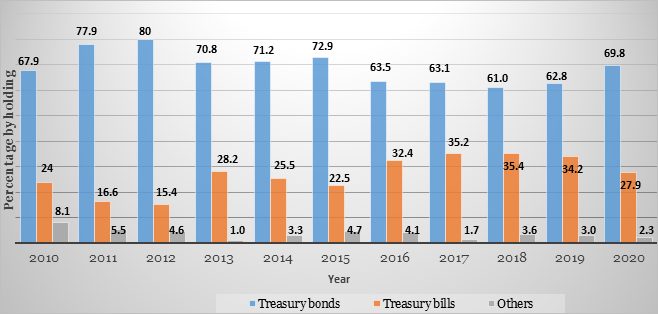
Data source: Annual Public Debt Reports, National Treasury, [2] 2010-2020
Issuance of longer-term domestic debt instruments such as treasury bonds in Kenya is a good debt strategy in reducing vulnerability to rollover risks. Rollover risk is a risk associated with the rollover of debt especially when interest rate on new debt is higher than the maturing debt or when government is unable to rollover maturing debt into new debt. One of the key indicators for measuring rollover risk is the amount of debt maturing in one year as a per cent of total debt. The rollover risk is usually high when there is an increase in proportion of debts maturing in one year. Table 1 shows the domestic debt in Kenya by maturities in years. Clearly, the proportion of debt maturing in less than one year (treasury bills) declined from 26.1 per cent to 25.0 per cent of total domestic debt between 2010 and 2020, respectively. Therefore, the debts maturing in 2 years and above (treasury bonds) constituted the largest share of total domestic debt between 2010 and 2020. Kenya’s domestic debt maturing in less than one year is declining while long-term debt with maturity of equal to or greater than 2 years is increasing. This clearly indicates the reduced exposure to rollover risk.
Table 1: Domestic debt by maturities in years
| Remaining Maturities in Years | 2010 | 2011 | 2012 | 2013 | 2014 | 2015 | 2016 | 2017 | 2018 | 2019 | 2020 |
| < one year (%) | 26.1 | 17.5 | 22.4 | 26.4 | 24.7 | 36.0 | 43.0 | 37.7 | 42.7 | 34.9 | 25.0 |
| 2-3 years (%) | 8.0 | 10.1 | 10.6 | 12.1 | 13.7 | 14.9 | 14.0 | 14.8 | 10.0 | 12.4 | 0.9 |
| 4-5 years (%) | 14.8 | 15.9 | 16.4 | 15.5 | 16.9 | 11.3 | 11.0 | 12.6 | 13.3 | 11.7 | 9.8 |
| 6-10 years (%) | 30.3 | 31.4 | 26.8 | 23.4 | 21.8 | 18.6 | 18.0 | 19.8 | 21.1 | 21.2 | 19.6 |
| Above 11 years (%) | 20.8 | 25.1 | 23.8 | 22.6 | 22.9 | 19.2 | 14.0 | 15.0 | 13.0 | 19.9 | 44.7 |
Data Source: Medium Term Debt Strategy Reports, National Treasury, 2010-2020
The decline in short-term debt (treasury bills) and increase in long-term debt (treasury bonds) is an indication that the government debt strategy to reduce rollover risks is bearing fruits. That said, treasury bonds with longer maturities are more likely to increase interest rate risks relative to treasury bills. This can create a dilemma as a government faces two choices: the first choice is issuance of long-term debts with low rollover risks and high interest rate risks, and the second choice is issuance of short-term debts with high rollover risks and low interest rate risks. A trade-off between rollover risks and interest rate risks is necessary in determining the appropriate treasury bill and bonds mix.
Interest rate risk is a phenomenon, common for domestic debt instrument with long maturities (treasury bonds), that occurs when the rise in market interest rate causes price of fixed rate bonds to decline. Government uses Average Time to Re-fixing (ATR) to measure interest rate risks. Average Time to Re-fixing (ATR) refers to the average time it takes until all principal payments in a debt portfolio are subjected to a new interest rate. The rule of thumb is that when ATR reduces, interest rates rise and vice versa. The ATR in Kenya dropped from 8.3 years to 6.3 years between 2010 and 2020, respectively. Similarly, during the same period, the commercial banks’ holdings slightly rose from 53.2 per cent to 54.0 per cent of the domestic debt, respectively. The increased holding of domestic debt by Commercial banks is a source of susceptibility to crowding out of the private sector. Crowding out effect refers to a situation where private sector investment declines owing to increased government domestic borrowing, consequently leading to financial market instability. Table 2 shows the domestic debt in Kenya by type of holder.
Table 2: Domestic debt by holder (in %)
| Holder | 2010 | 2011 | 2012 | 2013 | 2014 | 2015 | 2016 | 2017 | 2018 | 2019 | 2020 |
| Commercial banks | 53.2 | 50.3 | 48.0 | 49.9 | 48.1 | 51.4 | 51.1 | 54.1 | 51.1 | 50.8 | 54.0 |
| CBK | 7.6 | 5.2 | 5.5 | 3.7 | 5.1 | 4.5 | 5.5 | 2.6 | 4.5 | 3.9 | 4.0 |
| Non-banks | 39.2 | 44.5 | 46.5 | 46.3 | 46.8 | 44.1 | 43.4 | 43.3 | 44.4 | 45.3 | 42.0 |
Source: Medium Term Debt Strategy Reports, National Treasury, 2010 to 2020
Alignment of domestic debt to the debt strategy mix
The alignment of actual domestic debt to the strategy outlined in the Medium-Term Debt Strategy (MDTS) is an important step in the management of domestic debt. However, the actual domestic debt often deviates from the MDTS. Table 3 presents the planned domestic debt under MDTS and actual outturn (in %) where a positive deviation indicates under-borrowing while a negative deviation indicates over-borrowing. From Table 3, domestic debt was under-borrowed by 28 per cent, 19 per cent and 16 per cent in 2013/14, 2014/15 and 2015/16, respectively. However, in 2016/17 and 2019/20 domestic debt was over-borrowed by 5 per cent and 16.6 per cent, respectively. Under-borrowing of domestic debt poses fiscal risks and therefore greatly hinders attainment of government fiscal targets while over-borrowing is likely to crowd out private investment.
Table 3: Planned domestic debt under MDTS and actual outturn (in %)
| 2013/14 | 2014/15 | 2015/16 | 2016/17 | 2017/18 | 2018/19 | 2019/20 | |
| MDTS | 60.0 | 55.0 | 55.0 | 40.0 | 40.0 | 43.0 | 62.0 |
| Actual | 32.0 | 36.0 | 39.0 | 45.0 | 45.0 | 42.0 | 78.6 |
| Deviation | 28.0 | 19.0 | 16.0 | -5.0 | -5.0 | 1.0 | -16.6 |
Source: Medium Term Debt Strategy Reports, National Treasury, 2013-2020
Conclusion
Thus, in looking at the policy option to maximize the government’s objective when issuing domestic debt instruments, it is necessary to pay attention to associated risks as part of the debt management strategy.
By William Musili and Silvanus Opiyo, Young Professionals, Macroeconomics Department
[2] Others consists of pre-1997 overdraft, tax reserve certificates and commercial bank advances